Most successful B2B teams track their numbers closely. Without tracking the right data, making progress becomes harder. The right numbers give you clear answers and show where to improve.
Want to know which metrics can improve your B2B sales? Let’s explore!

What Is Sales Performance?
Sales performance shows how well a team turns leads into customers and generates revenue. It measures how productive and effective your team is and how successful your sales strategies are.
Factors like competition, product quality, and customer needs can affect sales performance. Knowing how these factors impact your results helps you find ways to improve.
The good news? You can track performance using simple metrics to get clear insights, make better decisions, and improve your sales process.
12 Sales Performance Metrics Examples
Here’s a simple breakdown of the key metrics every B2B team should focus on:
1. Lead Conversion Rate
Lead conversion rate tells you how many leads become customers. It shows how well your sales and marketing teams turn prospects through the sales funnel and closing deals.
Formula
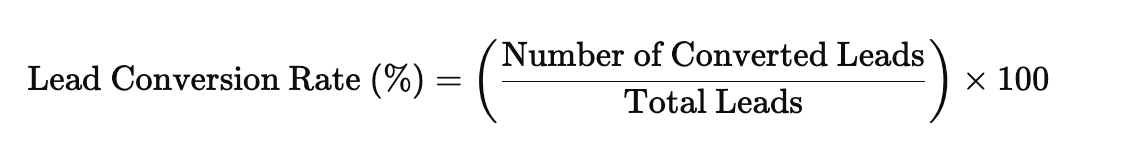
When you have 200 leads this month, and 50 of them become customers, your lead conversion rate is:

Lead conversion rate helps you see how well your sales process is working. A high rate means your team effectively reaches the right prospects and closes deals. A low rate might point to issues like poor-quality leads, unclear messaging, or missed follow-ups.
By tracking this metric, sales managers can:
- Spot areas where the sales process works well or needs improvement.
- Coordinate with marketing to bring in better-quality leads.
- Focus on stronger follow-ups to improve conversions.
For B2B teams, tracking this number ensures efforts are focused on what works.
2. Sales Cycle Length
Sales cycle length measures the duration you first talk to a prospect and when the deal is closed. It shows how quickly your team works on opportunities.
Formula

If your team closes five deals in a month, and the time taken for each deal is:
- Deal 1: 20 days
- Deal 2: 30 days
- Deal 3: 25 days
- Deal 4: 15 days
- Deal 5: 10 days
The total time to close all deals is 100 days. Using the formula:

If your sales cycle is short, your process is efficient and generates revenue faster. A long sales cycle could mean delays from poor follow-ups or a complicated process.
By tracking this metric, sales managers can:
- Identify where deals get stuck in the pipeline.
- Spot opportunities to improve the sales process.
- Set realistic expectations for revenue forecasting.
Use this metric to improve how your team works and close deals quicker without compromising the quality.
3. Customer Acquisition Cost (CAC)
CAC tells you how much you’re spending to add a new customer. It includes everything from marketing tools and ads to team salaries and campaigns. This number helps you understand the cost of growing your business.
Formula

If you spend $50,000 this month and bring in 100 customers:

Your CAC will be $500 for each customer.
Tracking CAC helps you see how effective your spending is. A high CAC could mean you’re overspending or need to improve your process. A low CAC shows your efforts are more efficient.
By tracking CAC, you can:
- Measure the return on investment.
- Spot areas where costs might be too high.
- Plan budgets more effectively.
Since B2B teams face longer sales cycles and bigger costs, watching CAC helps you attract customers while staying within your budget.
4. Customer Lifetime Value (CLV)
CLV measures the total income a customer generates for your business over time. It’s a key way to understand your profits and the role of keeping customers loyal.
Formula

Let’s say:
- Average purchase value = $200
- Purchase frequency = 5 times per year
- Customer lifespan = 3 years
Using the formula:
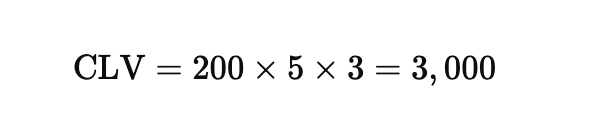
This shows the customer is expected to bring in $3,000 in revenue over their time with your business.
CLV helps you think beyond one-time sales, showing how much each customer contributes in the long run. It guides how you spend on attracting and keeping customers.
With CLV, you can:
- Spot high-value customers and give them extra attention.
- Plan smarter budgets based on long-term impact.
- Create strategies to keep customers and grow their value.
Knowing CLV helps B2B teams maintain customer loyalty and build steady growth over time.
5. Monthly Recurring Revenue (MRR)
MRR is the consistent income your business makes every month from subscriptions or repeat contracts. It’s an important metric to measure steady revenue and assess your financial stability.
Formula

If you have 150 customers, each paying $300 per month on average, your MRR is:

This means your business earns $45,000 in recurring revenue every month.
MRR tracks steady revenue, helps you manage money, and makes it simple to plan your budget and forecast income.
When you track MRR, you can:
- Monitor how upgrades, downgrades, or new customers change revenue.
- See trends in customer retention and cancellations.
- Test if your pricing strategies are working.
For B2B teams, MRR provides a clear view of long-term growth and helps focus on building consistent, recurring income.
6. Sales Pipeline Value
The sales pipeline value shows how much money your team could make from current deals. It’s a simple way to see the potential impact of ongoing opportunities on your revenue.
Formula
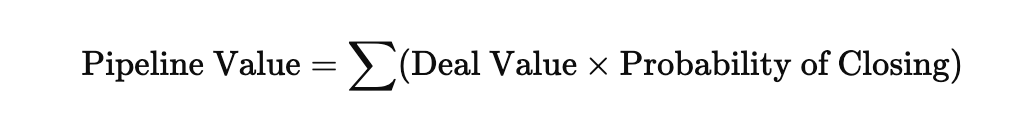
If you have three deals in your pipeline:
- Deal 1: $10,000 with a 50% probability of success
- Deal 2: $8,000 with a 70% probability of success
- Deal 3: $12,000 with a 30% probability of success
The pipeline value is calculated as:

Your pipeline value is $14,200.
Sales pipeline value tells you how much money your team could make if all current deals move forward. It’s an important metric for planning sales and setting clear revenue goals.
When you track this metric, you can:
- Evaluate how strong your pipeline is.
- Spot missing opportunities or weak areas.
- Prioritize deals with higher potential.
For B2B teams, where sales take longer and involve more people, pipeline value helps manage resources and stay on target.
7. Win Rate
Win rate shows the percentage of deals your team closes out of all the opportunities they work on. It helps you see how effectively your team turns leads into customers.
Formula

If your team worked on 50 opportunities in a month and closed 15 of them, your win rate is:

This means your team closes 30% of the deals they go after.
A high win rate shows strong performance, while a low rate might mean challenges like poor prospect targeting or weak messaging need to be fixed.
Tracking this metric helps you:
- Understand the quality of leads your team is handling.
- Spot where deals are stalling or falling apart.
- Set practical goals for your team to work toward.
For B2B teams handling detailed and long sales processes, improving win rate boosts revenue and makes your sales process smoother.
8. Quota Attainment
Quota attainment shows the percentage of sales targets a rep or team hits in a set time. It’s an important metric to measure how well the team is performing and reaching goals.
Formula

If a salesperson has a monthly target of $50,000 and closes $40,000 in sales, the quota attainment is:
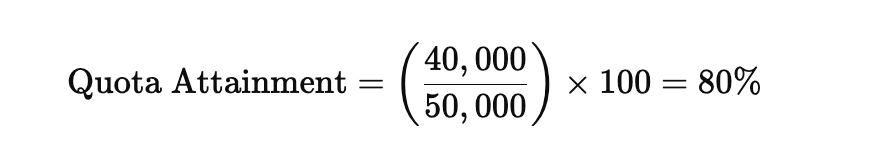
This means the rep achieved 80% of their monthly sales goal.
Quota attainment helps measure performance and evaluate your sales strategy. If reps keep missing targets, it may mean goals are too high, processes need adjustments, or additional training is required.
Sales managers can use this metric to:
- Recognize top performers and address gaps in the team.
- Create practical and motivating goals for the team.
- Keep the team’s efforts focused on the company’s goals.
For B2B teams with longer sales processes, tracking quota attainment helps fine-tune strategies and support reps in reaching their goals.
9. Average Deal Size
Average deal size measures how much each closed deal is worth on average during a specific time. It gives insights into the revenue you generate and patterns in the customers or industries you work with.
Formula
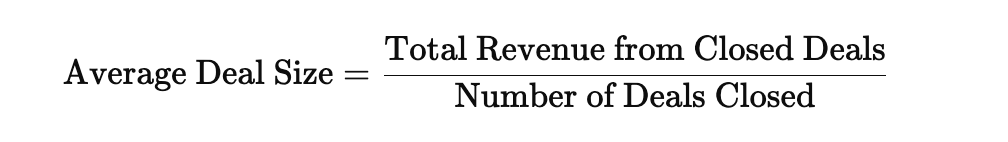
If your team closed 10 deals in a quarter and generated $100,000 in revenue, the calculation would be:
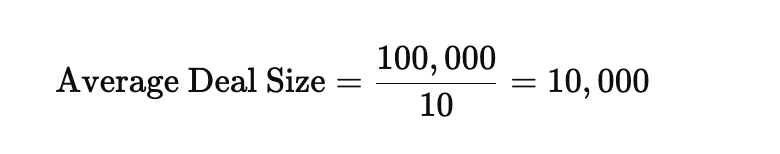
This means the average revenue per deal is $10,000.
Knowing your average deal size helps you:
- Spot patterns in how customers spend.
- Focus on deals with higher value.
- Set realistic revenue targets based on deal size.
For B2B teams, this metric is key since bigger deals often take more time and involve more decision-makers. Analyzing this can help you target higher-value deals or balance your pipeline with smaller and larger opportunities.
10. Churn Rate
Churn rate shows the percentage of customers you lose in a specific period. It’s important to understand how well you’re keeping customers and keeping your revenue stable.
Formula
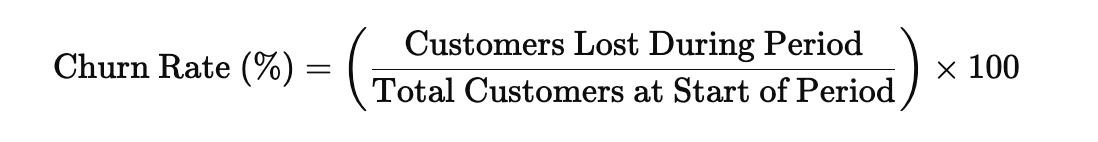
If your company starts the month with 500 customers and loses 25, the churn rate is:
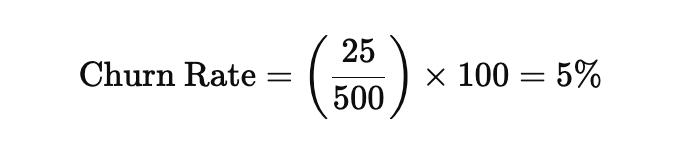
Your churn rate for the month is 5%.
A high churn rate can mean customers are unhappy or not getting what they need. It affects your steady income and the overall health of your business.
By tracking the churn rate, you can:
- Identify patterns in customer loss.
- Uncover reasons why customers leave, such as product issues or poor service.
- Focus on keeping customers by offering smoother onboarding or more helpful support.
In B2B sales, cutting churn is essential because finding new customers takes a lot of work. Lower churn brings in more revenue and builds stronger customer loyalty.
11. Sales Activity Metrics
Activity metrics measure your team’s daily tasks, like calls, emails, meetings, and follow-ups. These numbers help you see how hard your team is working.
While results-based metrics show outcomes, activity metrics reveal the effort behind those results. Monitoring these metrics helps you:
- Measure team productivity.
- Identify patterns in successful sales behaviors.
- Pinpoint areas where additional support or training is needed.
Examples of Sales Activity Metrics
- Calls made per day – Tracks how often reps reach out to prospects.
- Emails sent – Measures outreach volume for nurturing leads.
- Meetings scheduled – Shows how many prospects move to the next stage.
- Follow-ups completed – Indicates how consistently reps engage with leads.
Activity metrics are not just about numbers but about understanding what works. For example, if a rep sends fewer emails but gets more meetings, it could mean they’ve improved their approach. Low activity, however, might show issues or roadblocks in the process.
For B2B teams, tracking sales activity metrics ensures your team stays on task, remains consistent, and focuses on the actions that drive results.
12. Customer Retention Rate (CRR)
CRR shows the percentage of customers who stay with your business. It helps you see how well you’re keeping customers happy and engaged with what you offer.
Formula
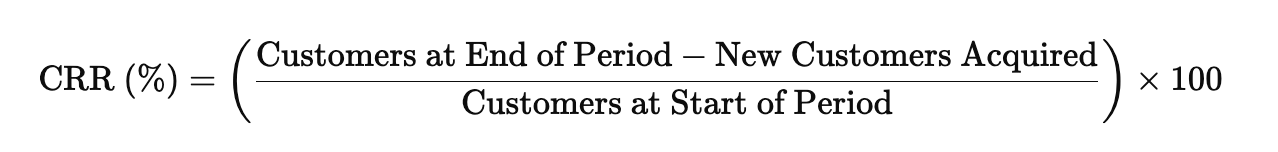
If, for the month of January, you have 200 customers, gain 50 new ones, and end with 230, here’s how you calculate it:

A 90% retention rate means most of your customers are loyal and happy with your business.
Retaining customers is cheaper than getting new ones. A higher retention rate means your customers are satisfied and loyal, which is key for steady growth.
Tracking retention rate lets you:
- Spot problems in your customer experience after the sale.
- Find ways to build better relationships with current customers.
- See how your lead management and sales strategies affect customer loyalty.
For B2B teams using LeadAngel, customer retention highlights the value of effective lead routing and nurturing strategies. When leads are managed and guided through the pipeline, they’re more likely to stick around, driving recurring revenue and increasing customer lifetime value.
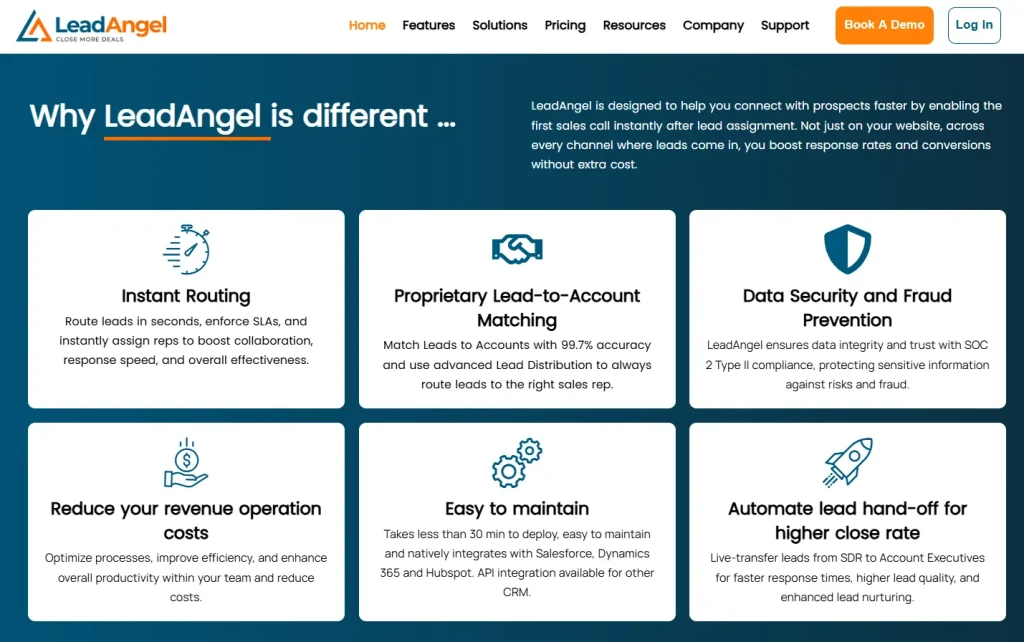
Enhance Your Sales Performance With LeadAngel
Tracking sales performance metrics matters, but having the right tools to improve your process is just as important. LeadAngel works alongside your CRM to make lead management easier so your team can focus on closing deals and getting results.
Here’s how LeadAngel supports your sales success:
- Fast lead routing – Leads are sent to the right team members immediately, cutting delays and increasing follow-up speed.
- Accurate lead-to-account matching – Organizes your CRM data, making it easy for your team to focus on the best opportunities.
- Clear lead-to-account matching – Keeps your CRM neat and organized, helping your team spot the right opportunities quickly.
- Quick CRM connections – Saves time by reducing manual tasks like data entry, letting your team focus on relationships, and closing sales.
LeadAngel removes unnecessary steps in lead management, making it easier for sales teams to stay focused, prioritize the right leads, and improve overall performance.
Make Sales Easier and More Effective With LeadAngel
Tracking these sales metrics is very helpful for your team to perform better and grow your business. For B2B teams, where sales cycles are often longer and involve multiple steps, having the right tools is key.
With LeadAngel complementing your CRMs, your lead management becomes simple by reducing manual tasks, organizing your data, and ensuring every lead gets to the right salesperson quickly. This means less wasted time and more focus on closing deals and building customer relationships.
Want to make your sales process easier and more effective? Sign up for free or book a demo with LeadAngel today. See how you can streamline your workflow, improve team efficiency, and achieve better results.
See How LeadAngel Can Transform Your Lead Management
Curious to experience the power of LeadAngel firsthand? We understand!
We're offering a complimentary trial so you can explore LeadAngel's features at your own pace. Once you request a free trial, we'll schedule a personalized onboarding session to ensure you maximize the value of LeadAngel.
Ready to take your lead management strategy to the next level? Request your LeadAngel trial today!
In addition to exploring the platform, we recommend visiting our LeadAngel Help Center for in-depth guidance. Our dedicated customer support team is also available to answer any questions you may have at sales@leadangel.com.
FAQs
It is a number that shows how well your sales team is reaching its goals. These metrics can include things like lead conversion rates, revenue, or customer retention. They help sales leaders and managers assess performance, identify areas for improvement, and guide decision-making.
1. Quota attainment - Evaluate whether sales reps meet or exceed their sales targets. 2 .Win rate - Measure the percentage of deals closed compared to total opportunities. 3. Sales activity metrics - Track daily actions like calls, emails, or scheduled meetings. 4. Revenue contribution - Analyze how much revenue each rep generates for the business. These methods offer a balanced view of effort and results, helping you gauge productivity and effectiveness.
To evaluate sales performance, set clear goals and track relevant metrics like quota attainment, sales cycle length, and customer acquisition cost (CAC). Regularly review these metrics to identify trends and gaps. Additionally: - Conduct one-on-one reviews with team members to understand challenges. - Use CRM tools to monitor individual and team progress through sales data insights. - Analyze customer feedback to see how well the team meets client expectations. Combining data analysis with direct feedback gives you a comprehensive picture of your team’s performance.
Key performance indicators (KPIs) are the sales metrics that matter most for tracking success. Common sales KPIs include: - Lead conversion rate: How many leads turn into customers. - Monthly recurring revenue (MRR): Predictable income generated each month. - Sales pipeline value: Total potential revenue from active deals. - Customer retention rate: Percentage of customers retained over time. - Win rate: Percentage of deals closed successfully. These KPIs help businesses focus on results and align team efforts with larger goals.